県内には砂浜が3つある。
1つは市内、もう1つは南の県境、最後1つは北の方。
この前市内のところに行ってきた。
結論から言うと、ちゃんと砂浜ではあったが、あまりおすすめできない場所であった。
数時間滞在すればそのうち出るだろうが、ポケストがないあそこに長時間滞在はしたくない。
なお、南の県境の方はゲット報告を見かけた。
自分はウミディグダはそのうちイベントでばらまかれるのを待とうと思う。
Users' Diaries
Recent diary entries
Posted by LucasPereira14 on 2 May 2024 in Brazilian Portuguese (Português do Brasil).

Hoje me dediquei a explorar mapas antigos, cada um repleto de histórias e segredos de eras passadas. Em especial, fiquei fascinado por um mapa da Era dos Descobrimentos, detalhando não só as terras conhecidas mas também as misteriosas e inexploradas. Foi uma jornada visual e intelectual através das coordenadas que moldaram a compreensão do mundo naquela época.
Um dos mapas, datado do século XVII, mostrava a Europa com suas cidades bem definidas, mas ao se aventurar para regiões mais distantes, as linhas tornavam-se conjecturas cheias de criaturas míticas. As coordenadas de Lisboa, por exemplo, estavam precisamente marcadas em 38.7223° N, 9.1393° O, uma janela para o ponto de partida de muitas das viagens marítimas históricas.
Esse mapa me levou a refletir sobre como os cartógrafos daquela época utilizavam as coordenadas disponíveis para mapear o conhecido e o desconhecido. Eles serviam não apenas como guias geográficos, mas também como narrativas visuais dos limites do mundo explorado. Assim, cada linha e cada número no mapa contam mais do que uma localização; eles narram as ambições, os medos e as maravilhas de uma era de descobertas. A cada coordenada revelada, percebi o quanto ainda há para descobrir sobre nosso passado e como ele moldou o presente.
Posted by LucasPereira14 on 2 May 2024 in Brazilian Portuguese (Português do Brasil).
Hoje comecei uma exploração virtual, guiada pelos mapas extensivos e movidos pela comunidade do OpenStreetMap. É fascinante como um esforço coletivo de todo o mundo pode se unir para mapear cada viela, rua e caminho com tanta granularidade detalhada. Esta jornada de código aberto me lembrou do entusiasmo pela descoberta, um sentimento que busco frequentemente, tanto online quanto offline.
Interessantemente, enquanto navegava por diferentes regiões no mapa, refleti sobre como a exploração não se limita a viagens físicas. Pode ser também sobre se aventurar em novas experiências ou revisitar territórios familiares com uma nova perspectiva. Isso é bastante semelhante a explorar o vasto mundo do entretenimento e jogos online, como os apresentados em Cassinos no Brasil. Assim como o OpenStreetMap revela novas vistas do mundo físico, Cassinos no Brasil desvenda uma paisagem vibrante e dinâmica de jogos e entretenimento, cada um oferecendo uma emoção e experiência única.
Seja mapeando uma nova trilha para caminhada ou experimentando um novo jogo, a alegria de descobrir novas facetas do mundo é infinitamente gratificante.
Posted by Raquel Dezidério Souto on 2 May 2024 in Brazilian Portuguese (Português do Brasil).
Last updated on 3 May 2024.
Oficina para turma do Centro de Investigaciones en Geografía Ambiental, da Universidad Autónoma de México - CIGA-UNAM
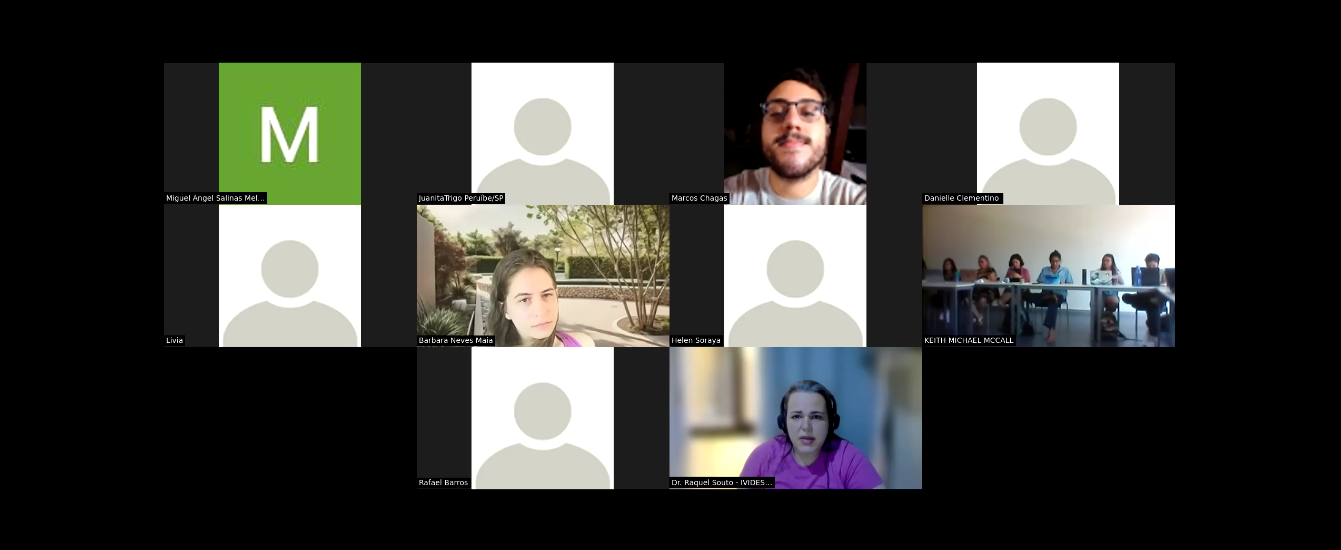
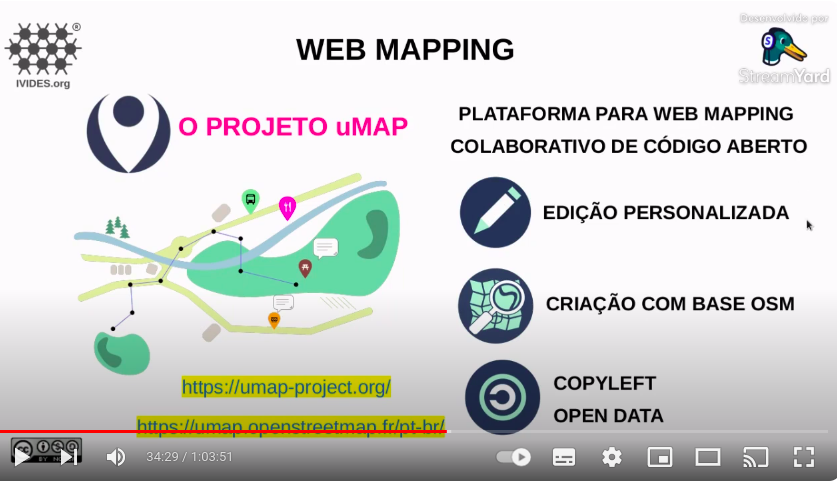
A convite, a Dra. Raquel Dezidério Souto (IVIDES.org) realizou oficina sobre criação de web maps com uMap e dados do OpenStreetMap (OSM) para uma turma do Centro de Investigaciones en Geografía Ambiental, da Universidad Nacional Autónoma de México, campus de Morelia, como parte do curso PACES.
A oficina abrangeu uma parte conceitual e outra, prática. O conteúdo abrangeu uma apresentação dos conceitos relacionados a web mapping; características, modelo de dados, editores e APPs do OSM; e características, vantagens e limitações do uMap, como solução para web mapping.
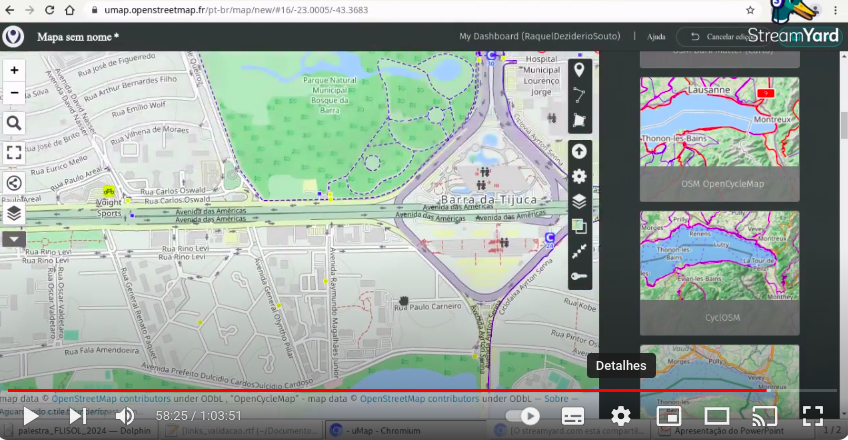
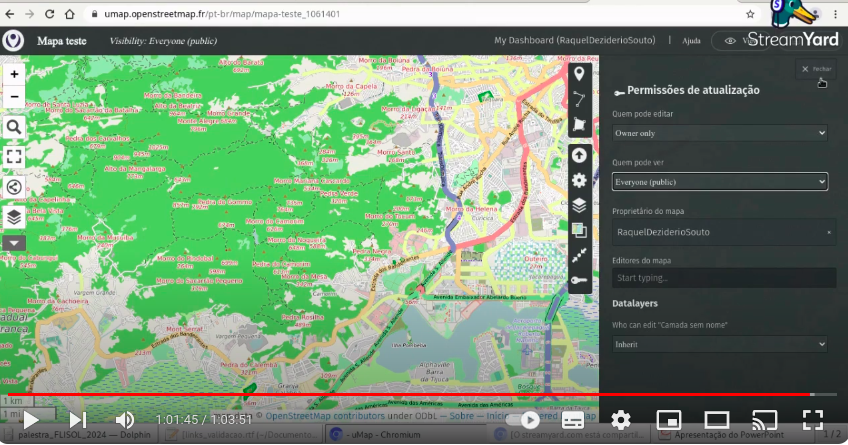
Na parte prática, foi mostrado como criar um web map, sendo necessário apenas criar uma conta de usuário no OSM. Como exemplo, foi demonstrada a importação de dados de um arquivo .csv como uma camada estática no uMap e a criação de uma camada dinâmica, que recupera dados automaticamente, por meio de uma instrução em Overpass QL. Além de comentários sobre permissões de edição e visualização do web map e peculiaridades relativas à aparência dos objetos no produto final.
A instrução em Overpass QL disponibilizada para recuperação automática de escolas que já estão mapeadas no OSM e visualização com camada dinâmica no uMap pode ser adaptada para outros objetos geoespaciais, como hospitais ou supermercados, por exemplo.
https://overpass-api.de/api/interpreter?data=[out:json][timeout:25];
(node["amenity"="school"]({south},{west},{north},{east}););out body;>;out center skel qt;
IVIDES.org® é uma marca registrada.
A gravação da sessão pode ser encontrada em:
Parte 1 - conceitual - canal do IVIDES.org® no YouTube
Parte 2 - prática - canal do IVIDES.org® no YouTube
![]()

Welcome to my fifth (and a half) OpenStreetMap NextGen development diary.
Tomorrow, I’m returning home and I’ll be able to resume work at full speed 🔥.
This is a short edition of the development diary.
🐙 This project is open-source and publicly available:
https://github.com/Zaczero/openstreetmap-ng
Intro
For the past 13 days I have been on a journey of finding a new place to rent. Without my home office, I wasn’t able to become productive. The place I’m staying at doesn’t have a good office spot and being on my laptop doesn’t help. However, I am now very motivated to get back to work and push even harder!
May Will Be Big
At the end of May, OpenStreetMap-NG will include necessary functionality to run on a testing server, as well as to invite new contributors into the project. Starting with 6th of May, I won’t have any time-consuming plans for this month so I’ll do my best to wrap everything up. What’s exactly left has been described in Diary #5 Short-Term Development Plan. I have already started to prepare the All-in-One Contributor Guide which will also be finished up (it currently lacks backend/frontend-specific guides). This is going to be the first major milestone of the project!
Project Sponsors 🏅
I was happily surprised to see new faces even during my lower activity period. I will do everything to deliver the promised results. As always, thank you for supporting the project, monetarily, and with staring the project on GitHub!
Currently, the project is sponsored by 13 people!
Five private and four public donors on Liberapay, and four public on GitHub Sponsors.
- ~1847430, gileri (Eric G.), LaoshuBaby (快乐的老鼠宝宝), RedAuburn (Harry Bond), ~1819511, AurimasF (Aurimas Fišeras), edpichler (Edu), starsep
Disclaimer
This project is not affiliated with the OpenStreetMap Foundation. It’s an independent and community-sponsored initiative.
How do I make a map of a California county showing population density?

Highway, Building, Barrier, Tower, Area, Landuse, and more.
if you history user of 2 years form highways this finding. was edit errors has been yandex map.
Posted by ZeLonewolf on 30 April 2024 in English.
Last updated on 2 May 2024.

There is a long discussion happening in the United States section of the community forum regarding where to draw the line between the “main” populated place node values, and specifically the place=* values of city and town in New England. I thought it would be useful to do a bit of analysis to see how these values are distributed across the database when compared to population. Through this analysis, I include all tags which have place values of city, town, village, hamlet, and isolated_dwelling. I also only include nodes that have a population tag.
My overpass query for each category looks like this:
[out:csv(::id,place,population;true;"|")][timeout:60];
node[place=city][population];
out;
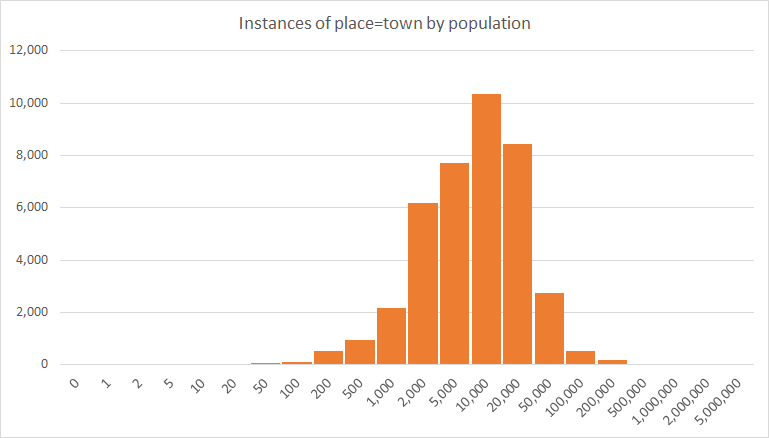
One of the challenges of analyzing this key is that because it represents order-of-magnitude differences, its distribution is log-normal. In other words, it forms a bell curve provided that the X-axis is drawn logarithmically.
To look at this data logarithmically, I grouped the place nodes logarithmically, in steps of 1, 2, and 5 per 10x jump. When viewing the distribution of place=town, the log-normal shape comes out quite clearly. The number on the X axis represents the upper limit of each bin.
Now that we’ve assessed that the data is distributed log-normally, the next question we want to be able to as is, for a populated place with a certain population, how are the place values distributed? For this, we look across each logarithmic “bin” and determine the percentage of each place value in use:
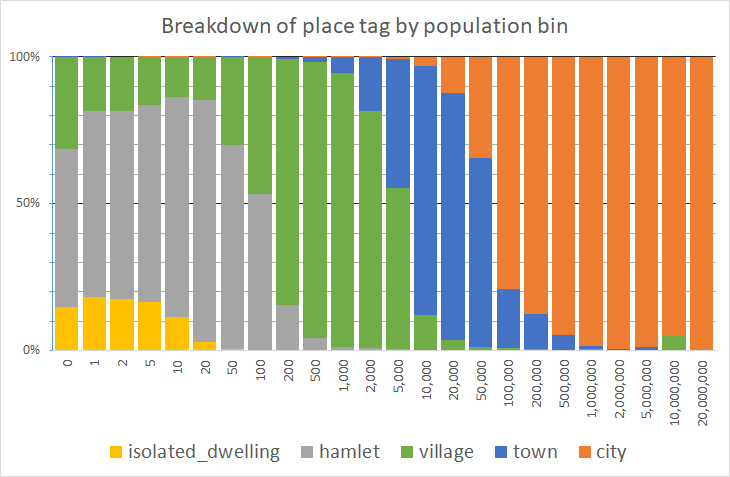
We can assess, for example, that for places with a population between 500 and 1,000 (the bin labeled “1,000”), it’s tagged place=village over 90% of the time. The village blip at 10,000,000 is the result of a data error - a single remote place node being erroneously tagged with a high population in a bin of size n=19. Needless to say, on the far right of this graph, there are fewer and fewer nodes in each bin.
Lastly, we would like to know the mean and standard devation of each place category. However, since this is log normal, we need to compute the mean and standard deviation in the logarithmic domain, and then convert it back. The mean, and plus or minus two standard deviations are computed in the table below:
| place= | -2σ | -1σ | μ | +1σ | +2σ |
|---|---|---|---|---|---|
| city | 8,341 | 33,118 | 131,496 | 522,118 | 2,073,119 |
| town | 782 | 2,814 | 10,124 | 36,422 | 131,039 |
| village | 13 | 71 | 393 | 2,173 | 12,011 |
| hamlet | 2 | 8 | 36 | 165 | 763 |
| isolated_dwelling | 0 | 2 | 6 | 22 | 84 |
Thus, this means that 68% of place=town nodes – one standard deviation – that are tagged with a population tag, have a population= value between 2,814 and 36,422. Taking this out to two standard deviations, 95% of all place=city nodes have a population= tag value between 8,341 and 2,073,119.
Clearly, there is considerable overlap between each category, no doubt because of differences in tagging conventions between places, differences in accounting for population, and differences in place tagging in areas of different population density.
Posted by Raquel Dezidério Souto on 30 April 2024 in Portuguese (Português).
Last updated on 2 May 2024.
✔ Oficina sobre criação de web map com uMap e dados do OpenStreetMap
✔ Palestra sobre criação de web map com uMap e dados do OpenStreetMap
✔ Oficina sobre importação de pontos de interesse (POI) no OpenStreetMap
✔ Mini curso para a Defesa Civil (Brasil)
✔ Oficina sobre mapeamento de pontos de interesse (POI) com OpenStreetMap
✔ Special interview about Brazilian NSDI on the first anniversary of YouthMappers UFRJ
✔ Entrevista especial sobre a INDE no aniversário de 1 ano do YouthMappers UFRJ
✔ YouthMappers UFRJ receives the Women’s Participation Award!
✔ YouthMappers UFRJ recebe o Women’s Participation Award!
✔ Our participation in the Open Data Day YouthMappers at UFBA 2024
✔ Nossa participação no Open Data Day 2024 do YouthMappers at UFBA
✔ Web map do mapeamento colaborativo para redução de riscos e desastes (RRD)
✔ Web map of colaborative mapping for the Disaster Risk Reduction (DRR)
✔ Mapear POI no OpenStreetMap e exibir dinamicamente com uMap
✔ Mapping POI in OpenStreetMap and displaying dynamically with uMap
✔ V Olimpíada Brasileira de Cartografia incluiu o OpenStreetMap como parte de sua etapa prática
✔ V Brazilian Cartographic Olympiad included OpenStreetMap as part of its practical stage
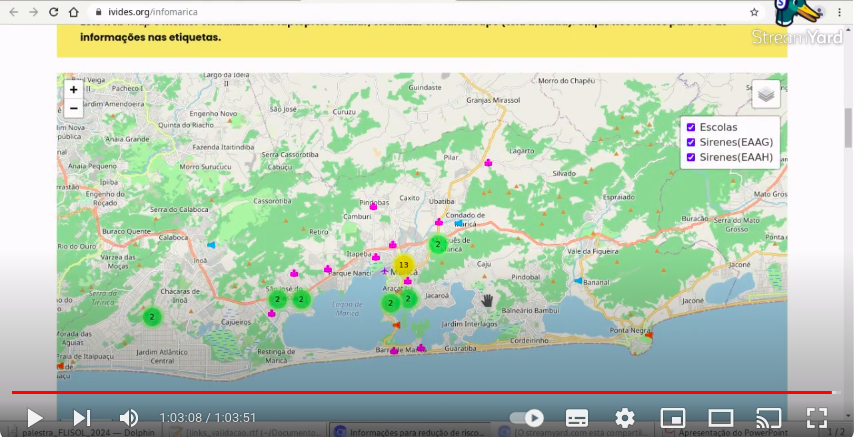
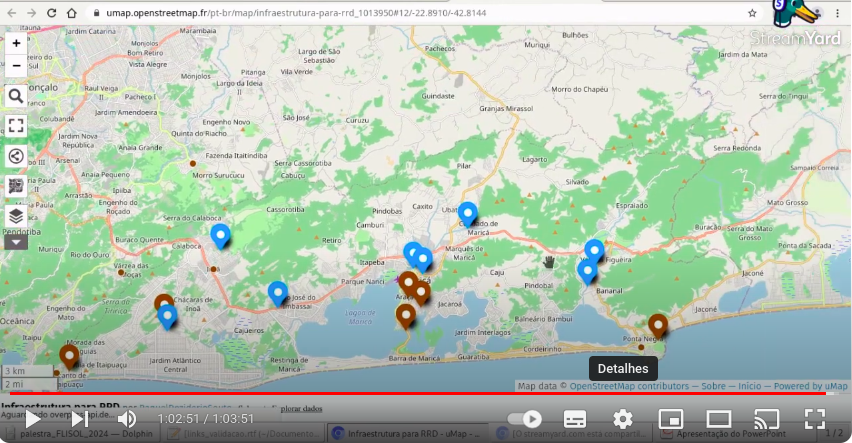
Posted by Raquel Dezidério Souto on 30 April 2024 in Brazilian Portuguese (Português do Brasil).
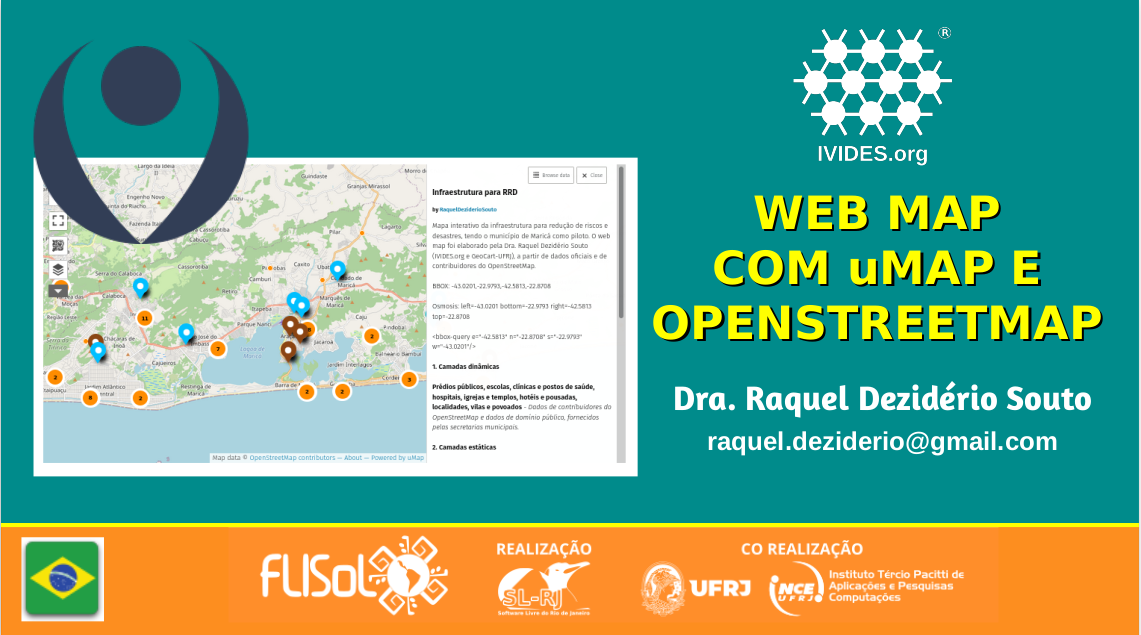
Participação no Festival Latinoamericano de Instalação de Software Livre - FLISoL Rio 2024
A Dra. Raquel Dezidério Souto, presidenta do IVIDES.org® e do YouthMappers UFRJ, ministrou palestra na edição carioca do FLISoL 2024, sobre Web map com uMap e OpenStreetMap, abrangendo os assuntos:
-
Conceitos básicos relacionados ao web mapping;
-
Características, modelo de dados, licença, acervos de dados, conversores, editores, APPs do OpenStreetMap;
-
Características do uMap, suas vantagens e limitações;
-
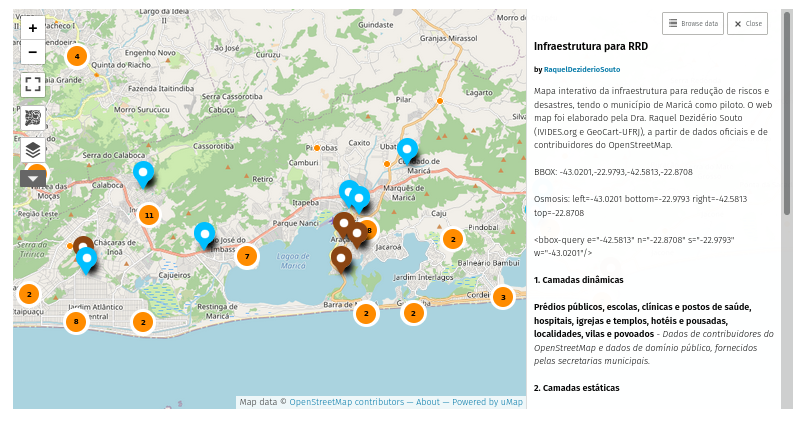
Estudo de caso - Web Map da Infraestrutura para Redução de Riscos de Desastres (RRD) no Município de Maricá (Rio de Janeiro, Brasil).
Todos os arquivos da apresentação podem ser encontrados na pasta virtual, que inclui a cópia do vídeo.
O vídeo da sessão pode ser encontrado também no canal do IVIDES.org® no YouTube.
Um agradecimento especial ao público participante ao vivo e aos(às) espectadores remotos! Agradecemos ainda aos(às) organizadores(as) do FLISoL Rio 2024, que contribuem para a disseminação do Software Livre na nossa cidade!
IVIDES.org® é uma marca registrada. Para entrar em contato sobre esta ação: ivides@ivides.org.

![]()
![]()

One of the most rewarding aspects of being an OpenStreetMap contributor is the surprise of discovering where your contributions will be displayed next.
“I put that obscure, forgotten place back on the map, and now they’re everywhere!”
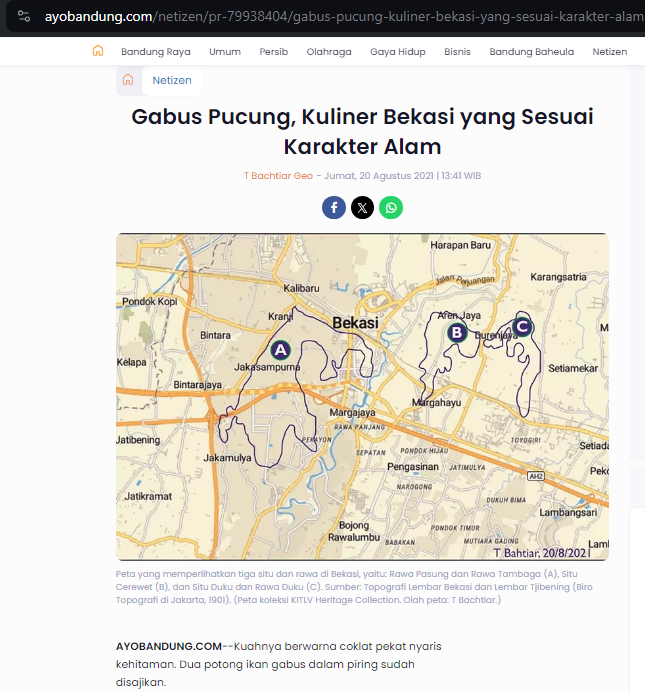
Researching toponyms is fun because I have to analyze the daily conversations among the locals and try to triangulate the place name centroid based on this conversations. Bonus point if my centroid triangulation somehow coincides with ancient, forgotten, historical maps.
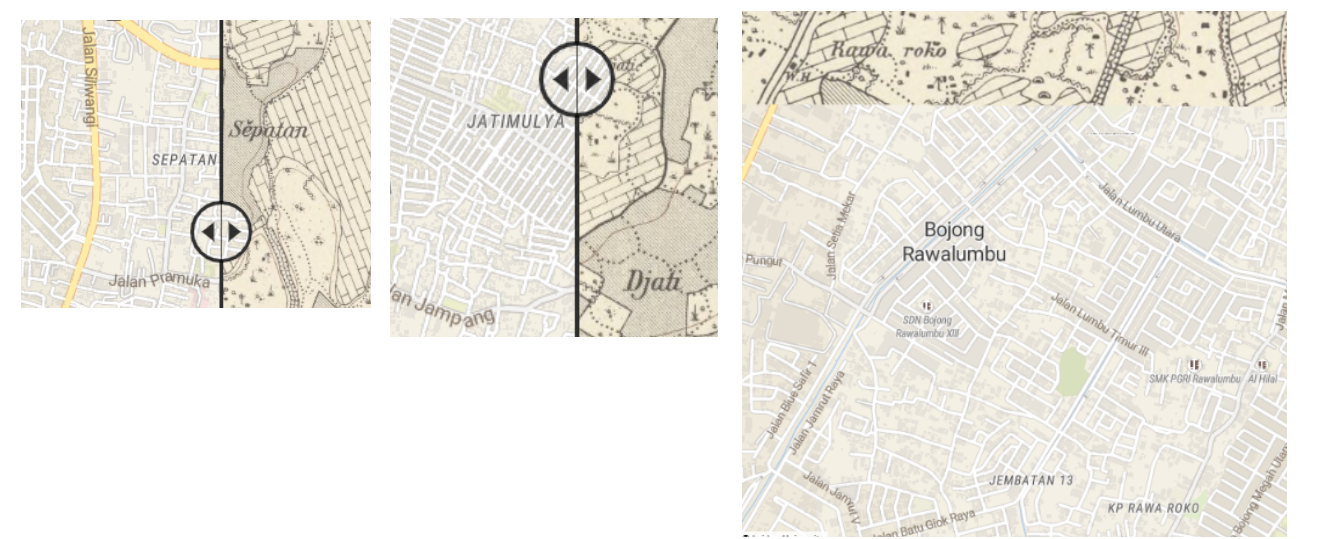
Traces of Sepatan, Djati, and Rawa Roko can still be found on old historical maps, circa 1900. Locals still use these toponyms right now, despite the government’s refusal to acknowledge their existence in the official addressing system.
It’s ‘forgotten’ in the sense that the local government over here has simplified the toponym system too much. Some toponyms have been upgraded to official administrative region names (and are now embedded in the official addressing system), while the rest have been left behind. People still use these ‘left-behind’ toponyms daily to refer to certain places, even though the government has somewhat ‘discouraged’ their use. (The colonial administration did it better, though. When I consulted the archives and library for old maps, all of these ‘left-behind’ toponyms were actually mapped quite well in the past.)
And this situation has led to mass confusion for people. Government-mandated addresses often don’t reflect reality. People still use all those ‘left-behind’ toponyms in their daily activities, yet they don’t appear on official, government-mandated maps and addressing systems.
That’s one of my personal missions right now: to put all those ‘left-behind’ toponyms back on the maps.
Posted by mvogelsteller on 29 April 2024 in German (Deutsch).
OpenStreetMap (OSM) ist ein kollaboratives Projekt, das es Nutzern ermöglicht, Karten und geografische Daten frei zu bearbeiten und zu nutzen. Dieses „Wikipedia der Kartenwelt“ bietet detaillierte Informationen zu geografischen Standorten und lokalen Ressourcen, die von einer aktiven Gemeinschaft aus freiwilligen Kartografen ständig aktualisiert werden.
Verbesserte Sichtbarkeit für Arztpraxen
Einer der größten Vorteile von OpenStreetMap ist die erhöhte Sichtbarkeit, die es Arztpraxen bietet. Durch die Registrierung ihrer Praxis auf OSM können Ärzte und Ärztinnen sicherstellen, dass sie von potenziellen Patienten leicht gefunden werden. Dies gilt für allgemeinmedizinische Hausärzte ebenso wie für spezialisierte Fachärzte wie Zahnärzte, Hautärzte, Gynäkologen, Urologen, Chirurgen, Psychiater, Neurologen, Augenärzte, Kinderärzte und sogar Tierärzte.
Routenplanung und Erreichbarkeit
Für Patienten ist es oft eine Herausforderung, den Weg zur nächsten Arztpraxis zu finden, besonders in unbekannten Gegenden. OpenStreetMap kann hier Abhilfe schaffen, indem es genaue und benutzerfreundliche Karten zur Verfügung stellt, die nicht nur die Lage der Praxis zeigen, sondern auch Informationen zu öffentlichen Verkehrsmitteln, Parkmöglichkeiten und barrierefreiem Zugang bieten. Dies verbessert die Erreichbarkeit und Patientenfreundlichkeit enorm.
Lokale Vernetzung und Community-Support
OpenStreetMap fördert nicht nur die individuelle Sichtbarkeit, sondern unterstützt auch die Vernetzung innerhalb der lokalen medizinischen Community. Praxen können leichter Kooperationen und Überweisungsnetzwerke mit benachbarten Fachärzten aufbauen, was insbesondere für spezialisierte Disziplinen wie Neurologen oder Psychiater von Vorteil sein kann.
Katastrophenhilfe und Notfallsituationen
In Notfallsituationen oder bei Katastrophen kann OpenStreetMap lebensrettend sein. Durch präzise Karten können Rettungsdienste schneller den Ort einer Praxis erreichen. Ebenso können Praxen wie die eines Kinderarztes oder eines Tierarztes in Krisenzeiten wichtige Anlaufstellen in der Gemeinde sein.
Marketing und Patientenakquise
Die Präsenz auf OpenStreetMap kann auch als kostengünstige Marketingstrategie dienen. Indem Arztpraxen auf OSM erscheinen, können sie ihre Sichtbarkeit gegenüber neuen Patienten erhöhen, ohne in teure Werbekampagnen investieren zu müssen. Dies ist besonders für neu eröffnete Praxen oder solche in stark umkämpften Gebieten wie bei Zahnärzten oder Hautärzten von Bedeutung.
Fazit
Die Nutzung von OpenStreetMap bietet für Arztpraxen eine Vielzahl von Vorteilen. Von der verbesserten Sichtbarkeit und Erreichbarkeit bis hin zur Unterstützung durch die lokale Gemeinschaft und effizienter Notfallhilfe – die Vorteile sind vielfältig. Ob Allgemeinmediziner oder Spezialist, die Integration in OpenStreetMap kann maßgeblich dazu beitragen, die Qualität der Patientenversorgung zu verbessern und gleichzeitig die Praxis besser in der lokalen Gemeinschaft zu verankern.
[Semi-automated translation of the Italian diary entry]
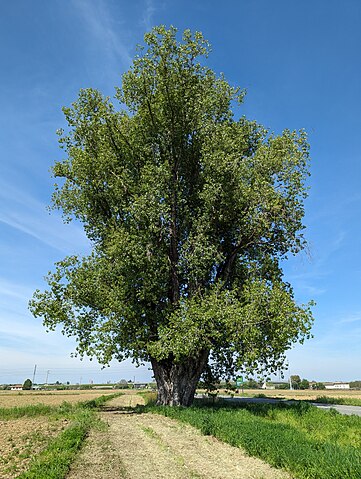
On OpenStreetMap, a tree can be represented as a natural=tree node.
Leaf type 🌿
leaf_type is the most common tree-related tag in the database, this is because it is easily verifiable and is supported with a quest by StreetComplete. The values are broadleaved and needleleaved. Some argue that palms should not be tagged as broadleaved but with a value of their own, =palm.
Leaf cycle 🍂
This tag describes whether a tree is deciduous or evergreen. Most needleleaved tree species are evergreen, but this is not always the case, so do not infer this value automatically. You can add this value easily if you know the species, or more simply if it is autumn/winter. If not, you can try to see if satellite or street-level imagery taken at those times are available.
Genus and species 🌳
If you are not an expert, there are tools that can help you recognise the genus/species of a plant, such as Pl@ntNet and iNaturalist, both of which also exist as mobile apps. On OpenStreetMap there are many trees with species (or species:wikidata or species:xx) that do not have leaf_type or leaf_cycle. These values are of course identical for each species (and also for many genus) and can therefore be easily deduced. There are two lists on the OSM wiki that contain these values for genus and species.
MapComplete has a dedicated tree theme that can be used to enter the species while SCEE has a dedicated quest (“What is the genus or species of this tree?”).
Monumental trees 🏛️
Monumental trees can be mapped adding denotation=natural_monument. In Italy they are recorded by the Ministry of Agriculture, Food Sovereignty and Forests (Masaf) with annual updates. You can map them by adding ref:masaf, which is a unique code assigned by the ministry.
In Poland they are recorded by the ‘Generalna Dyrekcja Ochrony Środowiska’ (GDOŚ) (you can find many of them with a query natural=tree+ref:inspire=*), in Serbia many zapis (sacred trees) are mapped with ref:zapis while b-unicycling has recently documented the place_of_worship=sacred_tree tag to map rag trees in Ireland and Scotland.
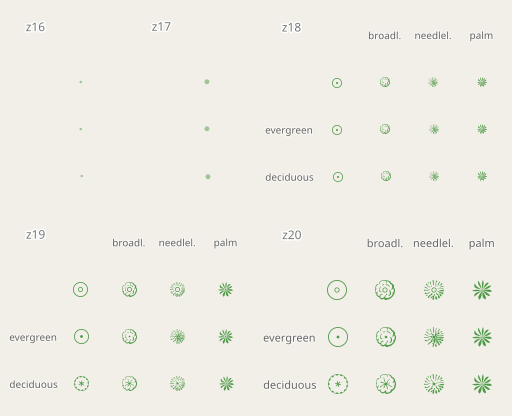
Rendering 🎨
Trees are rendered on Carto as green circles with a brown dot in their centre, regardless of their attributes. 
The Straßenraumkarte Neukölln renderer shows the trees differently according to leaf_type, circumference and diameter_crown. However, the web map only works for the Berlin district of the same name.
F4 Map and Streets GL (no longer updated) are 3D renderers that use the height tag. F4 Map distinguishes trees by foliage type and also supports some values to differentiate palm trees. Esri also has a 3D map that uses OSM data, and which should support height and also some genus values.
On the IMAGICO.De blog, there is an interesting article that goes into detail on possible renderings to highlight the various attributes.
QA 🛠️
There are more than 20,000 mapped trees, but QA tools are still few. That is why I created this MapRoulette project: Tree Validation.
There are challenges that compare values in the database with the largest values ever recorded in nature, for example trees taller than Hyperion. Other challenges concern uncommon or incorrect values of denotation, species, genus, leaf_cycle or leaf_type.
The hope is that in the future more and more tools will check on tree tagging. For now there is at least one open issue for Name Suggestion Index and one for Osmose/JOSM.
If you want to discuss trees on OSM, you can use the “tree” tag on the OpenStreetMap Community Forum.
Have fun mapping!
Su OpenStreetMap, un albero può essere rappresentato come un nodo natural=tree.
Leaf type 🌿
leaf_type é il tag maggiormente valorizzato nel database, questo perché é facilmente rilevabile (basta un’occhiata) ed é supportato con un’apposita quest da StreetComplete. I valori sono broadleaved (latifoglia) e needleleaved (aghifoglia). C’é chi sostiene che le palme non debbano essere taggate come latifoglia ma con un valore tutto loro, =palm.
Leaf cycle 🍂
Questo tag descrive la caduta fogliare, cioè se un albero é caducifoglio o sempreverde. La maggior parte delle specie di alberi aghifoglia sono sempreverdi, ma non é sempre così, non inferite quindi questo valore automaticamente. Questo tag é facilmente compilabile se conoscete la specie, o più semplicemente se é autunno/inverno. In caso contrario potete provare a vedere se sono disponibili immagini satellitari o foto a livello stradale scattate in quei periodi.
Genus e species 🌳
Se non siete esperti, esistono degli strumenti che possono aiutarvi a riconoscere il genere/specie di una pianta, come Pl@ntNet e iNaturalist, entrambi esistono anche come app mobile. Su OpenStreetMap esistono moltissimi alberi con species (o species:wikidata o species:xx) che non hanno leaf_type o leaf_cycle. Questi valori sono ovviamente identici per ogni specie (e anche per molti generi) e quindi possono essere facilmente deducibili. Sulla wiki di OSM esistono due liste che contengono questi valori per genere e specie.
MapComplete ha un tema dedicato agli alberi che può essere utilizzato per inserire la specie mentre SCEE ha una quest dedicata (“What is the genus or species of this tree?”).
Alberi monumentali 🏛️
Il Ministero dell’agricoltura, della sovranità alimentare e delle foreste (Masaf) ha censito (con aggiornamenti annuali) gli alberi monumentali d’Italia. Potete mapparli aggiungendo loro il tag denotation=natural_monument e ref:masaf. Quest’ultimo é un codice univoco assegnato dal ministero.
Solitamente un albero monumentale dovrebbe avere tutti i seguenti tag valorizzati: ele,species,species:wikidata,height,circumference,leaf_type e leaf_cycle. Questa query Overpass mostra gli alberi monumentali mappati al momento ed evidenzia quelli il cui tagging potrebbe essere migliorato: link
All’estero anche la “Generalna Dyrekcja Ochrony Środowiska” (GDOŚ) in Polonia censisce gli alberi monumentali (potete trovarne molti con una query natural=tree+ref:inspire=*), in Serbia molti zapis (alberi sacri) sono mappati con ref:zapis mentre b-unicycling ha recentemente documentato il tag place_of_worship=sacred_tree per mappare i rag tree in Irlanda e Scozia.
Rendering 🎨
Gli alberi sono renderizzati su Carto come dei cerchietti verdi con un puntino marrone al loro centro, a prescindere dai loro attributi.
Il renderer Straßenraumkarte Neukölln mostra gli alberi in modo differente in base a leaf_type, circumference e diameter_crown. La web map funziona però solo per l’omonimo quartiere di Berlino.
F4 Map e Streets GL (non più aggiornato) sono renderer 3D che utilizzano height per visualizzare l’altezza degli alberi. F4 Map distingue gli alberi per tipo di fogliame e supporta anche alcuni valori per differenziare le palme. Anche Esri ha una 3D map che utilizza dati OSM, e che dovrebbe supportare height e anche alcuni valori di genus.
Sul blog di IMAGICO.De esiste un interessante articolo che approfondisce possibili rendering per evidenziare i vari attributi.
QA 🛠️
Esistono più di 20.000 alberi mappati, ma gli strumenti di QA rimangono ancora pochi. Per questo motivo ho creato questo progetto MapRoulette: Tree Validation.
Ci sono challenge che confrontano i valori nel database con i valori più grandi mai registrati in natura, ad esempio alberi più alti di Hyperion. Altre sfide riguardano valori poco comuni o errati di denotation, species, genus, leaf_cycle o leaf_type.
La speranza é che in futuro sempre più tool proporranno check di vario genere sugli alberi. Per ora esiste almeno una issue aperta per il Name Suggestion Index e una per Osmose/JOSM.
Se volete discutere di alberi su OSM, potete utilizzare il tag “tree” sull’OpenStreetMap Community Forum.
Buon mapping!
I’ve finished (for a second time!) mapping all the paths in my local cemetery. The first time another mapped decided that concrete or gravel ways designed for walking on weren’t “paths” and deleted them all. He also seemed to have strong feelings about people cycling in cemeteries, which is odd as The Greater Metropolitan Cemeteries Trust actually endorse it as a use of their land. As my daughter is buried in the cemetery I feel some ownership of the place, and do love it and Merlynston creek that flows through it. I’m hoping no one vandalises my work again.

I received a request to update my previous list of people who map every single day. The top 3 places remain the same, with Aurimas Fišeras passing the 10 year mark of non-stop mapping! Congratulations on an amazing accomplishment, and a big thank you to all of these dedicated mappers!
| Consecutive Days | First Day of Streak | User |
|---|---|---|
| 3672 | 2014-04-03 | Aurimas Fišeras |
| 2810 | 2014-08-09 | vichada |
| 2687 | 2016-10-22 | ika-chan! |
| 2256 | 2018-02-17 | LidaCity |
| 2106 | 2018-07-17 | Algebre gama |
| 1943 | 2018-06-02 | thetornado76 |
| 1943 | 2018-12-27 | hendrik-17 |
| 1894 | 2014-06-15 | roschitom |
| 1860 | 2017-04-13 | looniverse |
| 1837 | 2019-04-12 | bxl-forever |
| 1828 | 2019-04-21 | JJIglesias |
| 1755 | 2019-07-03 | Sammyhawkrad |
| 1674 | 2019-09-22 | Zrop |
| 1631 | 2019-11-04 | mstock |
| 1629 | 2018-06-26 | phiphou |
| 1583 | 2018-10-06 | fx99 |
| 1544 | 2018-10-29 | BCNorwich |
| 1501 | 2014-06-26 | RoadGeek_MD99 |
| 1467 | 2017-11-04 | dvdhoven |
| 1450 | 2018-02-16 | alkushi |
| 1392 | 2019-10-25 | marczoutendijk |
| 1346 | 2017-10-28 | piotrS |
| 1336 | 2020-08-25 | NieWnen |
| 1318 | 2020-09-12 | Strubbl |
| 1305 | 2020-09-25 | mindedie |
| 1292 | 2017-12-11 | vincent_95 |
| 1291 | 2020-10-09 | Leonius_Bad |
| 1286 | 2020-10-14 | Grass-snake |
| 1259 | 2020-11-10 | SekeRob |
| 1240 | 2020-11-29 | seattlefyi |
| 1211 | 2015-01-28 | lodde1949 |
| 1159 | 2017-02-05 | futurumspes |
| 1153 | 2019-02-10 | jmapb |
| 1149 | 2021-02-28 | MJabot |
| 1092 | 2019-03-21 | mmahmud |
| 1070 | 2016-06-15 | mindedie |
| 1064 | 2018-08-12 | ikiya |
| 1063 | 2017-12-02 | 下り専門 |
| 1055 | 2019-07-22 | Nesim |
| 1031 | 2021-06-26 | vincent_95 |
| 1026 | 2015-09-25 | Nesim |
Posted by umbraosmbr on 27 April 2024 in English.
SotM Latam 2024 - Belém/Pará - Brasil.
The State of the Map Latam 2024 will take place in the city of Belém, Brazil, from December 6 to 8, 2024 at the Instituto Federal do Pará, this being the sixth edition of the ‘Latin American OpenStreetMap Conference’ and aiming to promote the use of OpenStreetMap (OSM), and the integration of OSM mappers, developers, open data communities, free and open source software communities, students, researchers, geoinformation professionals, non-governmental organizations, companies and public institutions.
SotM Latam 2024 After the voting period for choosing the SotM Latam 2024 logo has concluded, I am pleased to announce that the chosen option is 1.


You can see the results and voting details in the document shared above: https://docs.google.com/document/d/15Kbotyc6UCcWQ2K7apPOnfqXSSDFfvlDQtZxM_Nkag4/edit
Website: http://2024.osmlatam.org
https://wiki.openstreetmap.org/wiki/ES:LatAm/Eventos/State_of_the_Map_Latam_2024
You can see the voting results and details in the previously shared document: https://lnkd.in/dQcDDFCv
an organization of UMBRAOSM Union of Brazilian mappers from Openstreetmap, Latam Community and Foss4g
SotM Latam 2024 organizing committee
Contact: state@osmlatam.org
Posted by busBR on 27 April 2024 in Brazilian Portuguese (Português do Brasil).
A Empresa Metropolitana de Transportes Urbanos de São Paulo (EMTU) anunciou um aumento significativo nas operações intermunicipais, adicionando 41 novas viagens em dias úteis em cinco linhas que servem diariamente cerca de 14 mil passageiros. A partir de 22 de abril de 2024, os usuários das regiões de Santana de Parnaíba, Francisco Morato, Jandira, Franco da Rocha e São Paulo experimentarão uma melhoria significativa na frequência dos serviços.
Detalhes da Ampliação do Serviço pela EMTU
As linhas metropolitanas que receberão os incrementos são operadas pela concessionária Anhanguera. Esta expansão inclui a adição de cinco novos ônibus, configurados para aumentar o conforto e a eficiência do transporte público nessas rotas.
A decisão de expandir as viagens foi baseada em um monitoramento contínuo e análises do Centro de Gestão e Supervisão da EMTU, que acompanha em tempo real a demanda e as operações dos ônibus.
Como Acessar os Novos Horários
Para os passageiros que desejam consultar os novos horários, a EMTU disponibiliza atualizações através de seu site oficial e pelo aplicativo para dispositivos móveis, disponível para iOS e Android.
Linhas com Incremento de Viagens
- Linha 852: Francisco Morato (Centro) para Santana de Parnaíba (Terminal Rodoviário da Fazendinha)
- Linha 346: Jandira (Jardim Nossa Senhora de Fátima) para Santana de 1. Parnaíba (Terminal Rodoviário Alphaville)
- Linha 352: Santana de Parnaíba (Cidade de São Pedro) para São Paulo (Lapa)
- Linha 216: Francisco Morato (Jardim da Alegria) para Franco da Rocha (Centro)
- Linha 386: Santana de Parnaíba (Várzea De Souza) para São Paulo (Pinheiros)
Sobre a EMTU
A EMTU, vinculada à Secretaria dos Transportes Metropolitanos do Governo de São Paulo, é responsável pela regulação e fiscalização do transporte intermunicipal nas cinco regiões metropolitanas do estado, que incluem São Paulo, Campinas, Sorocaba, Baixada Santista, e Vale do Paraíba / Litoral Norte. Com um serviço que atinge aproximadamente 2 milhões de passageiros por dia, a EMTU desempenha um papel crucial no desenvolvimento do transporte público eficiente e sustentável.